Thanks to Probabilistic Models of Cognition for helping me understand this.
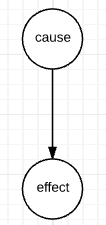
In a graphical model, causal relationships are represented with an arrow going from the cause to the effect:
In addition to cause and effect, you can read statistical dependence from a graphical model: $a$ and $b$ are statistically dependent if knowing something about $a$ influences your belief about $b$. This relationship is not always commutative; observing nodes changes the rules [of bayes ball]. Screening off and explaining away are names for rules about statistical dependence in a graphical model.
## Screening off
$b$ *screens off* $a$ from $c$ if $a$ and $c$ lose statistical dependence when $b$ is observed. You can think of it like a screen in basketball. Here is the original model, with statistical dependencies:
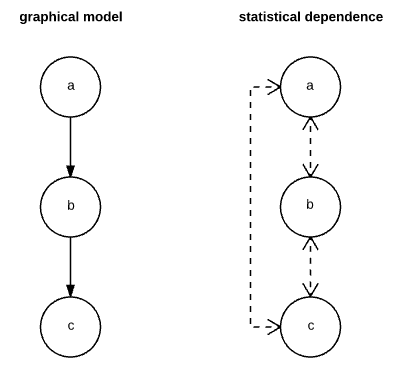
Here is the model when $b$ is screening off $a$ from $c$. $b$ is darkened because it is observed.
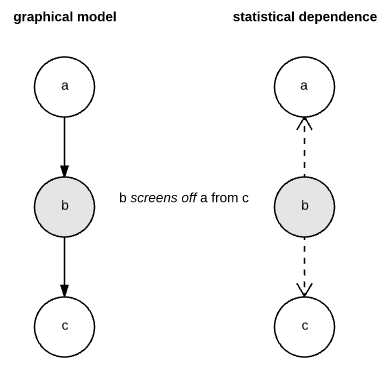
Now, if you observe something about $a$, it won't change your belief about $c$, since you already know $b$.
## Explaining away
In this model, $a$ explains away $b$ if $c$ is observed and we know something about $a$. Here is the original model, before $c$ is observed:
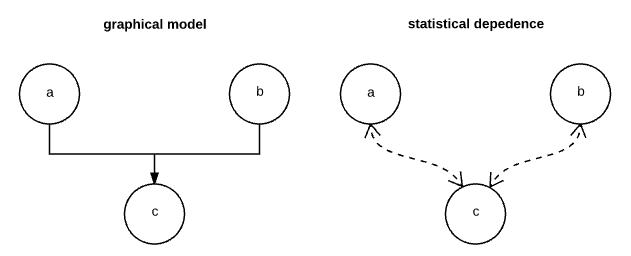
Here's what happens to dependencies if $c$ is observed:
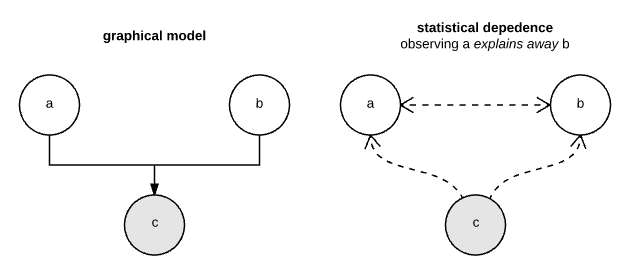
If we observe the value of $c$, knowledge about $a$ now influences our beliefs about $b$.
If you'd like to learn about the rules of statistical dependence in graphical models, [check out the rules of bayes ball](https://ergodicity.net/2009/12/08/bayes-ball-in-a-nutshell/). In Anand's image, screening off is demonstrated in the first row, second column. Explaining away is demonstrated in the third row, second column.
If you're interested in graphical models, I found these [videos by Daphne Koller](https://class.coursera.org/pgm/lecture) helpful.
